Author: Moin Zaman

March 29, 2024

Stock picking – thoughts on finding winners and holding through growth

Have you ever found a winning stock early, but:

  • Sold it too early?
  • Sold it when its share price was falling?
  • Sold it to hoping you could buy it back again cheaper but couldn’t?

Have you thought you found a winning stock, but it turned out to be a loser, and held it too long?

We have, and it still happens occasionally, but we’ve understood how best to find the gems and then hold them for compounding returns over the years.

One of our measures of investing success is if we’ve generated Alpha.

Alpha refers to excess returns earned on an investment above the benchmark return.

Fahd and I have spent over a decade making Alpha by individual stock picking. Picking winners and then, more importantly, holding them through sustained growth.

I have distilled some of our thoughts and ideas around stock picking to generate Alpha in this article.

The edge in investing lies beyond fundamental analysis

If all knowable information is reflected in share prices at all times, then one will not make money by knowing what everyone else knows.

Knowing what others don’t is the edge.

Knowledge is power, even when it comes to investing. The knowledge that comes from deep understanding of that which others have not understood yet.

He / She with the most information wins.

Now we’re not talking about the insider knowledge from within the company, which is illegal to obtain and trade on. Companies are bound by law and ASIC’s continuous disclosure agreement to immediately disclose market sensitive news to the public.

To explain how the apparent knowledge doesn’t impact share prices, let’s use an example.

8-week investing competition review – short term strategy

We have an on-going discussion on our premium forum about mid-term and short-term strategies, whether it’s something that’s possible or worth doing.

I think about and discuss it with Fahd from time to time. He has some experience with this and so did his father. Fahd and his portfolio team, in previous jobs, did some active investing while managing very large portfolios, where its best to trim positions, sell and lock in some profits etc. as things change in the markets Particularly because, with larger amounts of capital, you can’t just buy small and micro cap companies without causing huge volatility and spikes in prices, which defeats the purpose of buying low and holding.

Anyway, I have tried a short to mid term approach a few times in the past with some success, however the cons have always been enough to deter me from exploring it again seriously; namely:

  1. Time needed to spend in front of the screen monitoring charts for entries and exits (4 hours per day minimum)
  2. Tax implications with full capital gains counted as income to be taxed
  3. Time / admin needed to track and lodge tax returns with so many trades
  4. Brokerage costs adding up

We have written in-depth about the cons of short-term trading and how a long term approach sets us up to beat other approaches consistently.

When I compare returns from short-term approaches with our returns from longer term investing through compounding, which takes way less day-to-day time and effort, it just makes it a no-brainer that it suits us better.

Not to mention, we wouldn’t be able to dedicate time to Tabarruk and members if we spent half a day or more trying to day-trade.

That being said, for the right investor, with the right mindset, time and risk tolerance, it could be worth trying.

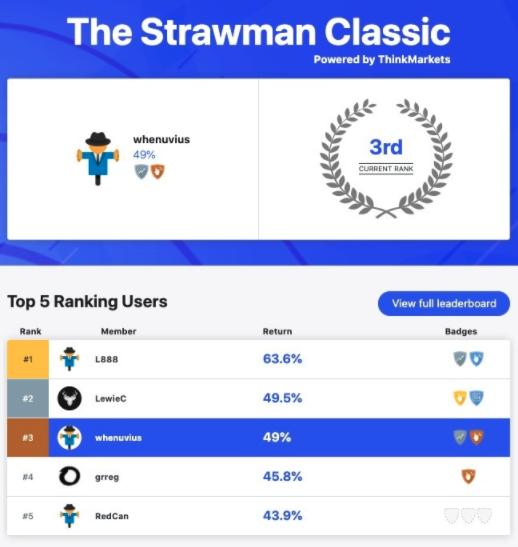
Case in point, my recent performance in the Strawman Classic, an 8-week virtual ASX stock picking competition. It finished last week, and I places 5th out of over 2,000 contestants. Fahd placed 34th.

Here is a run down of some of my thoughts from our experience and the strategy I used.

I am a fan of virtual portfolios and game based investing like the ASX game and Strawman Classic, especially for new investors and children to learn the basics and try things.

In my video interview with the founder of strawman.com, Andrew Page, he mentioned how I’d been part of the platform since June 2020. I didn’t know there would be a competition and was just playing around with the website and discussion format while researching features and premium forum plans for Tabarruk.

Strawman had a few constraints:

  1. A 20% maximum limit on any one company, i.e. out of a 100k, no more than 20k could be invested in any one company.
  2. Trading in the competition was not real-time. Any trades entered during market hours were matched and executed on the closing price of the company on that day. So any day-trading or intra-day trades was not possible.
  3. The winner would be the portfolio with the highest %age returns in 8 weeks (not $ value)

I bought a few companies with the $100,000 virtual money and forgot about it until an email arrived announcing the competition. I discussed it with Fahd, and we both thought why not attempt to try a slightly different strategy in the game and see what would happen. Fahd made an account for himself too. Fahd decided to go with a more mining and rare earth focus, I decided to stay fluid and mix the best of what sectors were in focus, like mining, biotech companies with binary milestones coming up etc.

We thought, at the very least we’d learn something, find some new companies, write or make a video about our experience.

The 8 week strategy we used was along these lines:

  1. Pick companies based on our normal framework including some from watchlist and pre-watchlist
  2. Shortlist to companies that had milestones expected in the next 8 weeks
  3. I couldn’t screen for 100% shariah compliance in all companies, but used Islamicly for a 1st pass
  4. I couldn’t spend the time to fully research all companies and picked some outliers that matched 1,2,3
  5. Every week, I reviewed the sectors and companies that came into focus
  6. I cut losers if their milestones had passed without growth
  7. I swapped out losers with new companies or increased positions in my winners

What eventuated was quite interesting. You can see my exact trades (20 in total) at https://strawman.com/whenuvius/trades.

A rundown and highlights of the 8 week period follows:

Before the competition began on October 19th, my 20k ADN holding had already grown and become about 25% of my folio.

Week 1,2 and 3

  • The first few weeks, some tech stocks dominated and set up the leaderboard.
  • Both Fahd and I ranked in the top 75 out of 2000 plus contestants.

Week 4 and 5

  • ADN and IBX both had positive announcements causing huge growth
  • I added a little MEP to my portfolio, which also followed ADN
  • I moved into 3rd place along with 3 other contestants who held ADN and MEP

Week 6

  • ADN and MEP kept gaining, IBX gained too
  • MSB has a positive announcement and surged 10%
  • I moved to 2nd place about 9% behind 1st place

Week 7

  • ADN and MEP started correcting, IBX held steady
  • MSB had another positive announcement
  • I attempted some swing trades with partial success
  • The UN reclassified Cannabis, US bill passed to decriminalise marijuana, and a cannabis company CPH, got new orders for their produce and in the span of 6 trading days, rose 1000%, 10 bags. The sector in general pumped.
  • I saw the sector start to pump, knew which companies looked ready to run, but obviously chose not to go there.
  • Instead, I cut my non-performers and loss makers (including MEP) to pull out $14k and bought DVL, Dorsavi, a biotech motion analysis wearable tech product manufacturer with contracts and evaluations pending.

Week 8 – Final 5 days of trading

  • The entire top 6 from the leaderboard of which most of us had ADN and MEP had shifter down to be replaced by a new top 5, all of whom held CPH, top 2 contestants with 200% and 180% returns.
  • I dropped down to 11th place with 51% returns
  • ADN, MEP and IBX all made slow gains
  • MSB held steady
  • With 3 days left, DVL announced an evaluation agreement with Medtronic, one of the largest medtech companies in the world.
  • The market realised the next day, DVL rising 100%

With 1 day left in the competition here’s how things stand:

  • I am ranked 4th with 71.7% returns
  • 1st place is 161.7% returns, followed by 129.6% for 2nd place and 80.8% for 3rd place
  • All of the top 3 contestants have CPH and other cannabis stocks in their folios.

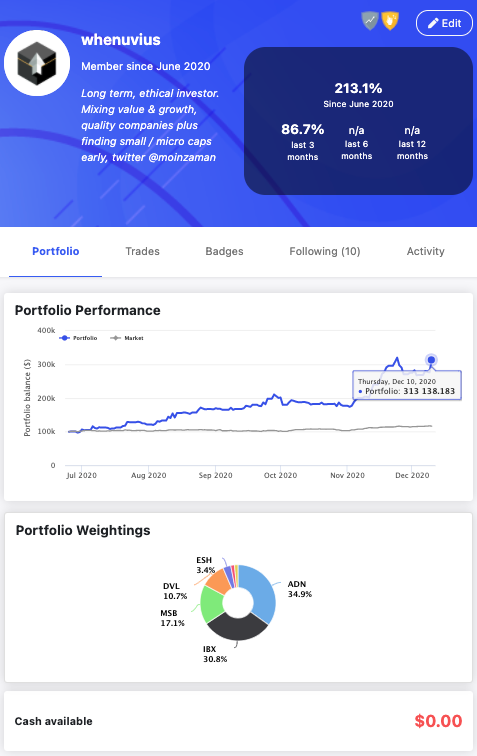
My portfolio in the game as of 10th Dec 2020

Things I did in game, that I’d rarely do for real

  1. Go ‘all in’, i.e. deploy all capital available to me
  2. Sell entire holdings of good companies for tiny amounts of profit
  3. Cut good companies just because they were not performing each week

Regardless of the outcome tomorrow, I’m humbled and proud to have not only featured in an interview on ausbiz, but also place high on a leaderboard where we could ‘compete’ and compare ourselves to peers, all while sticking to our principles and tailored strategy. Fahd ays that I have well and truly lived up to the title of being the best halal and ethical investor in the competition, and if it weren’t for the pot sector and CPH pump, I’d have most likely won.

I think he’s a touch biased 😉. The high risk, not fully researched, binary event dependent biotech companies, could have backfired on me. I mean, the two biotechs IBX and DVL didn’t even make it to our real watchlist or folios at Tabarruk. We may look into them a bit in our premium webinars and dig deeper if there’s serious long term potential.

To conclude, I see this performance in the competition, more as validation when we started Tabarruk, how we compared our past performance to similar players in the market and found that we were genuinely beating not just them and the market but other analysts, funds and investment gurus too. We felt confident that we were the best in our niche.

My starting portfolio value was $182,000.
My ending portfolio value after 8 weeks was $307,000.
Total profit of $125,000.
Total profit percentage was just short of 70%.

Side note on taxes in the real world

If this was the real world, assuming a yearly salary of $100,000, to realize my 8-week profit of almost 70% in full, I would’ve closed all my positions, and have all my capital gains counted as income, to be taxed $74,347, meaning I would take home about $50,000.

If I’d closed my positions, keeping all the other percentages the same, I would have only half of the profit counted as capital gains, meaning taxes would be $47,622, so I’d take home $78,000.

How can overseas investors buy shares in Australia on the ASX?

With the Australian economy recovering at a steady pace, ahead of many other parts of the world, the interest in global investors looking to invest in Australia is surging.

So, how do regular investors, like us, living outside Australia, or with family and friends interested in investing in Australian company shares?

All you need is:

  • any online broker
  • ability to fund the broker account by bank transfer or card
  • lists Australian Securities Exchange (ASX) equities / stock

Here are some options for that we know of, and members are using around the world, in places like India, Sri Lanka, United Kingdom, South Africa, USA, Pakistan, UAE, Malaysia, Indonesia, Singapore and other countries.

IG Trading

✅   #1 cheapest fee per trade at $6 (but be aware)

✅   Minimal deposit $200

❌   Withdrawal fee $10


Interactive Brokers

✅   Commission based trades

✅   No withdrawal fee

❌   Minimum deposit $10,000

❌   Inactivity fee $10 – $20 per month if account balance less than $2,000


SAXO

✅   Commission based trades

✅   No withdrawal fee

❌   Minimum deposit $2,000

❌   25 GBP after 3 months of no trades

❌   No live chat or 24/7 support


A lot of these options, for non-Australian residents, would not be able to link a CHESS / HIN to the individual as they would not have a Tax File Number. They would instead hold the shares on your behalf, giving you the legal ownership of them through their holding entity. Because of this, users can’t take part in dividend reinvestment plans.

You can also find more brokers using a broker comparison website like brokerchooser.com


.


Investing Psychology – Part 5: Conviction backed by research & Mindset patterns

Part 4 delved a little into how charts show group behaviour. The feedback has been great and Fahd and I plan on doing a whole series of videos and articles on charts.

To appreciate this instalment in the series, I recommend a refresher of Part 3 – Holding with patience, where the growth really happens.

Fahd and I are long term, growth and value investors, not short-term traders, and we believe in detailed research. We also mix finding smaller companies or misunderstood companies earlier than the rest of the market, taking positions early and holding with conviction backed by in-depth research.

As Fahd likes to say, if we can’t talk convincingly about a company we hold for 15 minutes straight, we’re not buying it.

After our research and analysis, we buy companies when the share price is below our long-term valuation and sell only when fundamentals change or they are significantly overvalued.

As shareholders, we act like owners of the company – we’re not sweating on daily share price variations, as you can imagine, no CEO worth their salt is sitting at their desk all day wondering if he or she should sell all their shares if the share price rises or falls by 10%.

Can you imagine Elon Musk selling out of Tesla early in its history so he could “leave some profit for the next guy”?

Following other’s recommendations blindly isn’t ideal

If there is one thing you can take away from this article, let it be this:

The main thing that allows you to hold during volatility is conviction and belief in your stocks. Conviction is non-existent when simply ‘following’ someone into a stock. Do not simply buy stocks based on social media tips, or because someone else purchased it.

Tabarruk’s ‘edge’ is conviction based on knowing our companies better than anyone else. Understanding and analysing the company, their product or service, the sector, the competition, the management and anything else that’s relevant, with in-depth research.

That is what creates conviction, which makes holding with patience possible.

Investing Psychology – Part 4: Charts uncover behaviour patterns – Dynamic of Gap Filling

From our last 3 instalments on Investing Psychology, in this edition, we go deeper into some patterns that occur as a result of group (buyer and seller) dynamics and the collective psychology of investors on the market.

People often look at stock price charts and take it in as what it appears to be at first glance, the history of price movements in the company’s share price over time. With the story of news announcements in the background as context one can add another layer and deduce that price sensitive announcements had an effect on driving prices up or down.

The layer that’s not commonly applied and used in analysis is that charts also represent human behaviour in terms of the psychology of buyers vs sellers.

When you add this lens to charts, you start to see patterns that stock charts tend to form often enough that technical analysis has labels for commonly occurring patterns. Google these and you’ll see what I mean – cup and handle, spinning top, bull flag, ascending triangle. There are some pretty fancy names out there.

From our previous series, we understand that emotions play a big role on the share market.  These emotions result in a tussle of supply and demand and prices fluctuate, telling a whole story.

Human beings tend to be creatures of habit.  And habits tend to repeat themselves, so it stands to reason that chart patterns occur often too.

There is a benefit of chart analysis in addition to all the fundamental in-depth research we do. It helps us attempt to eliminate emotion from investment decision making, by getting a visual data-based read on the emotional drivers of others in the market. 

We believe in being students of the fundamental analysis, as well as chart patterns.  To learn and understand chart patterns is to learn about the psychology behind price movements. 

We plan on picking some useful patterns we see and providing our explanation on them in a series of articles.

Familiarity with chart patterns helps us uncover some big winners in the market by technical analysis and also to come up with a plan of what possible entry points to take positions in companies could be.

For members, let’s take a closer look at one of the patterns of market dynamics that play out often, gap filling.

Investing Psychology – Part 2: Share price movements

So now that we have a handle on what ‘the market’ is from Part 1 of the series; Investing Psychology – Part 1: What ‘the market’ really is, let’s take a closer look at the machinations of price movements on the market. An important question to have answered first is;

Q: How is a share’s price determined and by whom?

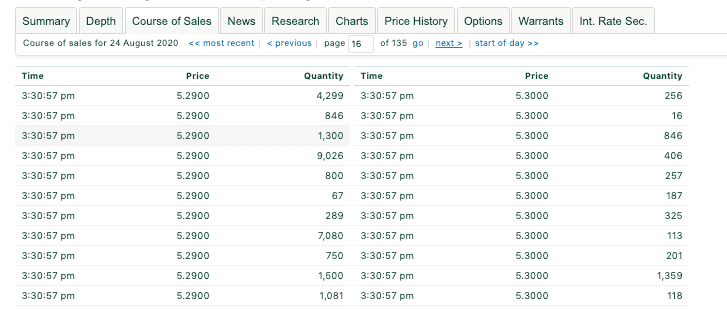
A: The last transaction where a buyer’s price and a seller’s price was matched is the share price at that moment in time. You can see this in most broker systems as ‘Course of Sales’ or ‘Trades’ to see the last transaction that was executed for the company.

So the price is determined by ‘us’ and executed by the broker system connected to the ASX (Australian Securities Exchange).

Course of Sales example

I didn’t know this myself and until it just clicked into place after a year of investing.

Investing Psychology – Part 1: What ‘the market’ really is

The way we think and behave, the core of who we are, and our level of self-awareness with regards to our emotions, all have a direct and significant impact on our results as investors.

The psychology of investing is something which has been written about in books and articles. ‘Fear and Greed’ are concepts that are tossed around as clichés and are obvious drivers of sentiment in the share market.

The emotions an investor experiences are more complex than fear and greed. The challenge is measuring the interplay between these emotions and the success attributed to one’s psychology.

In the first part of this series, I set the context around what ‘the market’ really is and also some insights that both Fahd and I have learned.

How much tax do you pay after selling shares on the ASX share market?

One of the most commonly asked questions is how do taxes work with stock market investing in Australia.

It can be hard for people to understand, and the documentation found online is often complex.

We break it down for you in this article.

Investments are taxed by the Australian Taxation Office (ATO), as something called a ‘Capital Gain’.

This term is given to any profit you make, when you sell your shares.

Capital gains from selling assets like shares are added on top of any income you make in the financial year. This would typically be your salary from your employer, that is over the minimum tax free threshold.

This total income is also known as your Total Taxable Income (TTI) in that financial year.

Capital Gains

Let’s say I buy a $20 share and sell it for $30, I’ve made a $10 Capital Gain.

There are two things to know about Capital Gains.

  1. If you hold a share for longer than 12 months (and 1 day) only 50% of your profit is added to your TTI. Meaning in the above example you would only add half of $10, which is $5 to your TTI.
  2. When you make a Capital Gain it can be offset by any Capital Losses you’ve made in your lifetime. So if you gain $30 this financial year but lost $10 in the last financial year, you only pay $20 in Capital Gains and immediately use up your $10 offset.

Also note that brokerage fees are included in your purchases, which means that if I want to buy a $100 share but the brokerage fee is $2 my entry price is $102.

Like wise if I sold the share for $150, I would actually only make $148.

It’s quite useful to use a spreadsheets to track your purchases and sales, and most brokers allow you to export a list of all your transactions as a spreadsheet for the financial year.

Dividends are added to TTI

Lastly, if you’re considering investing in companies that offer dividends, your dividends are added to your Total Taxable Income the same financial year that they’re paid, rather than when you decide to sell the shares.

Let’s use a few examples.

Example 1, person earning $80k, selling shares for a profit of $10k

Let’s say you earn $80,000 per year as a salary from your job.

And you’ve owned some shares for over a year and have now sold them this financial year to make a profit (the difference between price sold on market and initial cost of purchase after removing the brokerage).

Assume the shares were purchased at $5,000 and sold at $10,020. $10 brokerage each for the buy and sell transactions.

This gives you: $10,020 – ($5,000 + $10 + $10) = $5,000 as your profit.

As you owned the shares for over over a year, your capital gains is only 50% of your profit, which is half of $5,000 = $2,500.

Add this to your yearly taxable income of $80,000, that gives you a TTI of $82,500.

Plug this into ATOs Simple Tax Calculator and it applies the different tax scales for 2019-2020 as follows:

Taxable IncomeTax On This Income
0 to $18,200Nil
$18,201 to $37,00019c for each $1 over $18,200
$37,001 to $90,000$3,572 plus 32.5c for each $1 over $37,000
$90,001 to $180,000$20,797 plus 37c for each $1 over $90,000
$180,001 and over$54,097 plus 45c for each $1 over $180,000

Based on the table above, for $82,500 we apply the tax from row 3.

$3,572 + ($82,500 -$37,000) x 0.325

= $18,359 total tax on a TTI including capital gains of $85,0000

Without the capital gains of $2,500 from selling the shares, your tax would have been $17,500 on $80,000 TTI.

So the portion of tax paid on $5,000 of profit from sale of shares ends up being $859, meaning you keep $4,141, your net return on investment.

Example 2: Person working part-time earning $18k, selling shares for $5k

Another example: Let’s say you are currently working part time and earn $18,000 per year.

You don’t pay any tax on this as it is under the tax free threshold. Now imagine you sell your shares which cost you $5,000 (after owning them for over a year) for $10,020. This is a profit of $5,000.

Apply the 50% discount on profit and that is your capital gains, half of $5,000 = $2,500.

You only pay tax on the amount over the tax free threshold. From row 2 in the tax scale table above:

Your TTI is $18,000 + $2,500 = $20,500.

($20,500 – $18,201) x 0.19

= $437 total tax on a TTI of $20,500

Your return on investment from the sale of your shares of $5,000 – $437 = $4,563.

Paying huge taxes on shares is a good problem to have

For you to end up with a massive tax bill you would have to have a huge Capital Gain.

In general worrying about your potential profit from shares being eaten away by a large tax bill isn’t practical.

If you do get a massive tax bill you should be fist pumping with the success, because it will means you made a profit much larger than the tax bill itself. The income scale at which it starts to even out is after a TTI of over 500k.

If you have any questions specific to your circumstances, your accountant will be able to explain things and how they might apply to you, all you have to do is ask.

Selling shares if they’re owned for less than 12 months is out of the scope of this article as we almost never do it, as long term value investors.

The main difference is that a 50% discount is not applied to any profits, but there are other factors that can change this, i.e. if one applied to be registered as a person in the business of share trading.

Top

Someone from Sydney (AU) bought a yearly subscription 13 days ago